See what is happening with your payments


"How many of our payments actually go through?"
It ought to be a simple question to answer. But when the numbers sit buried among transactions, error codes and different payment methods, getting a proper overview can quickly take more work than you expected.
Now it is all in one place in ePay Backoffice under Analytics, spread across three pages.
Payments: see how your customers pay
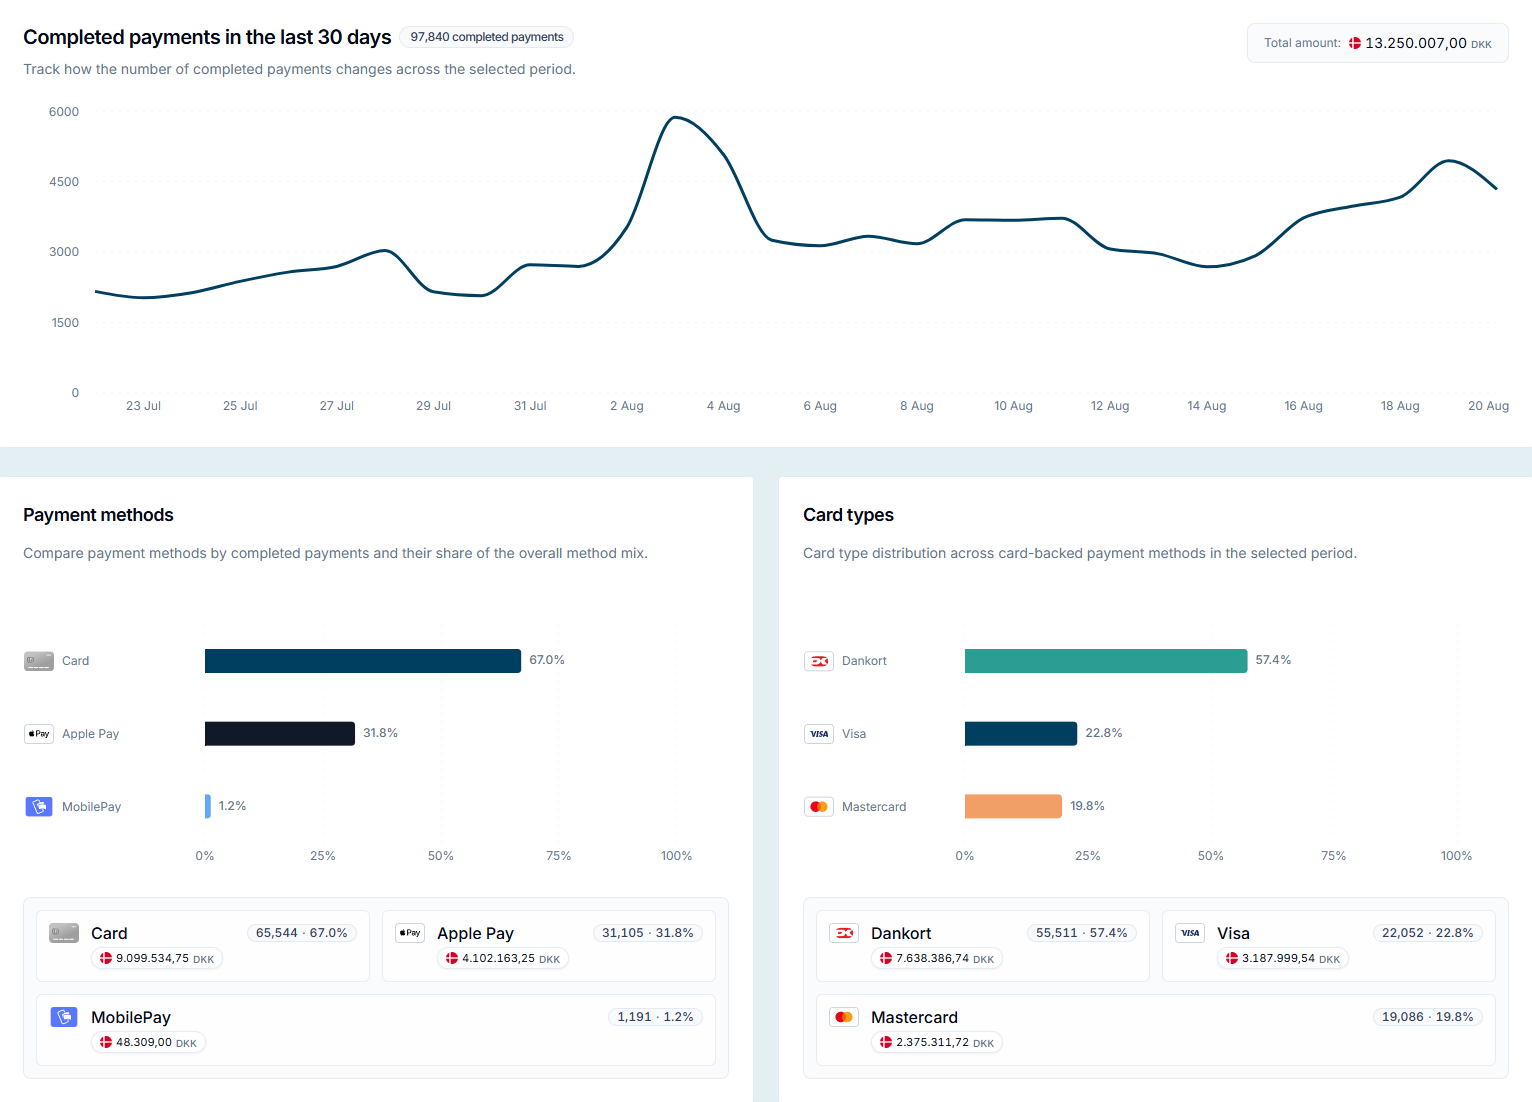
At the top of the page you get a graph of completed payments, with the number of completed payments and the amount for the period you have selected beside it, split by currency. Below it, you can see payments broken down by payment method, card type, device, browser, operating system and countries.
For each breakdown you can see both the number of payments and the amount that goes with it, split by currency. That way you can see the difference between what your customers use most often and what carries the largest amounts. The percentages are calculated on the number of payments, not on the amount, so a method with many small payments can fill more of the graph than it does of your revenue.
The payment method breakdown shows which payment methods your customers use. If MobilePay, the mobile wallet most Danes have on their phone, makes up a large share of your payments, it is worth making sure the method sits clearly in your checkout and works well on mobile. A payment method with very limited use, on the other hand, can be a reason to consider whether it is still relevant to your business.
The card type breakdown shows the split by card scheme, which is the network behind the card: Dankort (the Danish domestic card), Visa and Mastercard. That gives you a more precise picture of which cards your customers actually use, and it can help you judge how the different cards should be presented in your checkout.
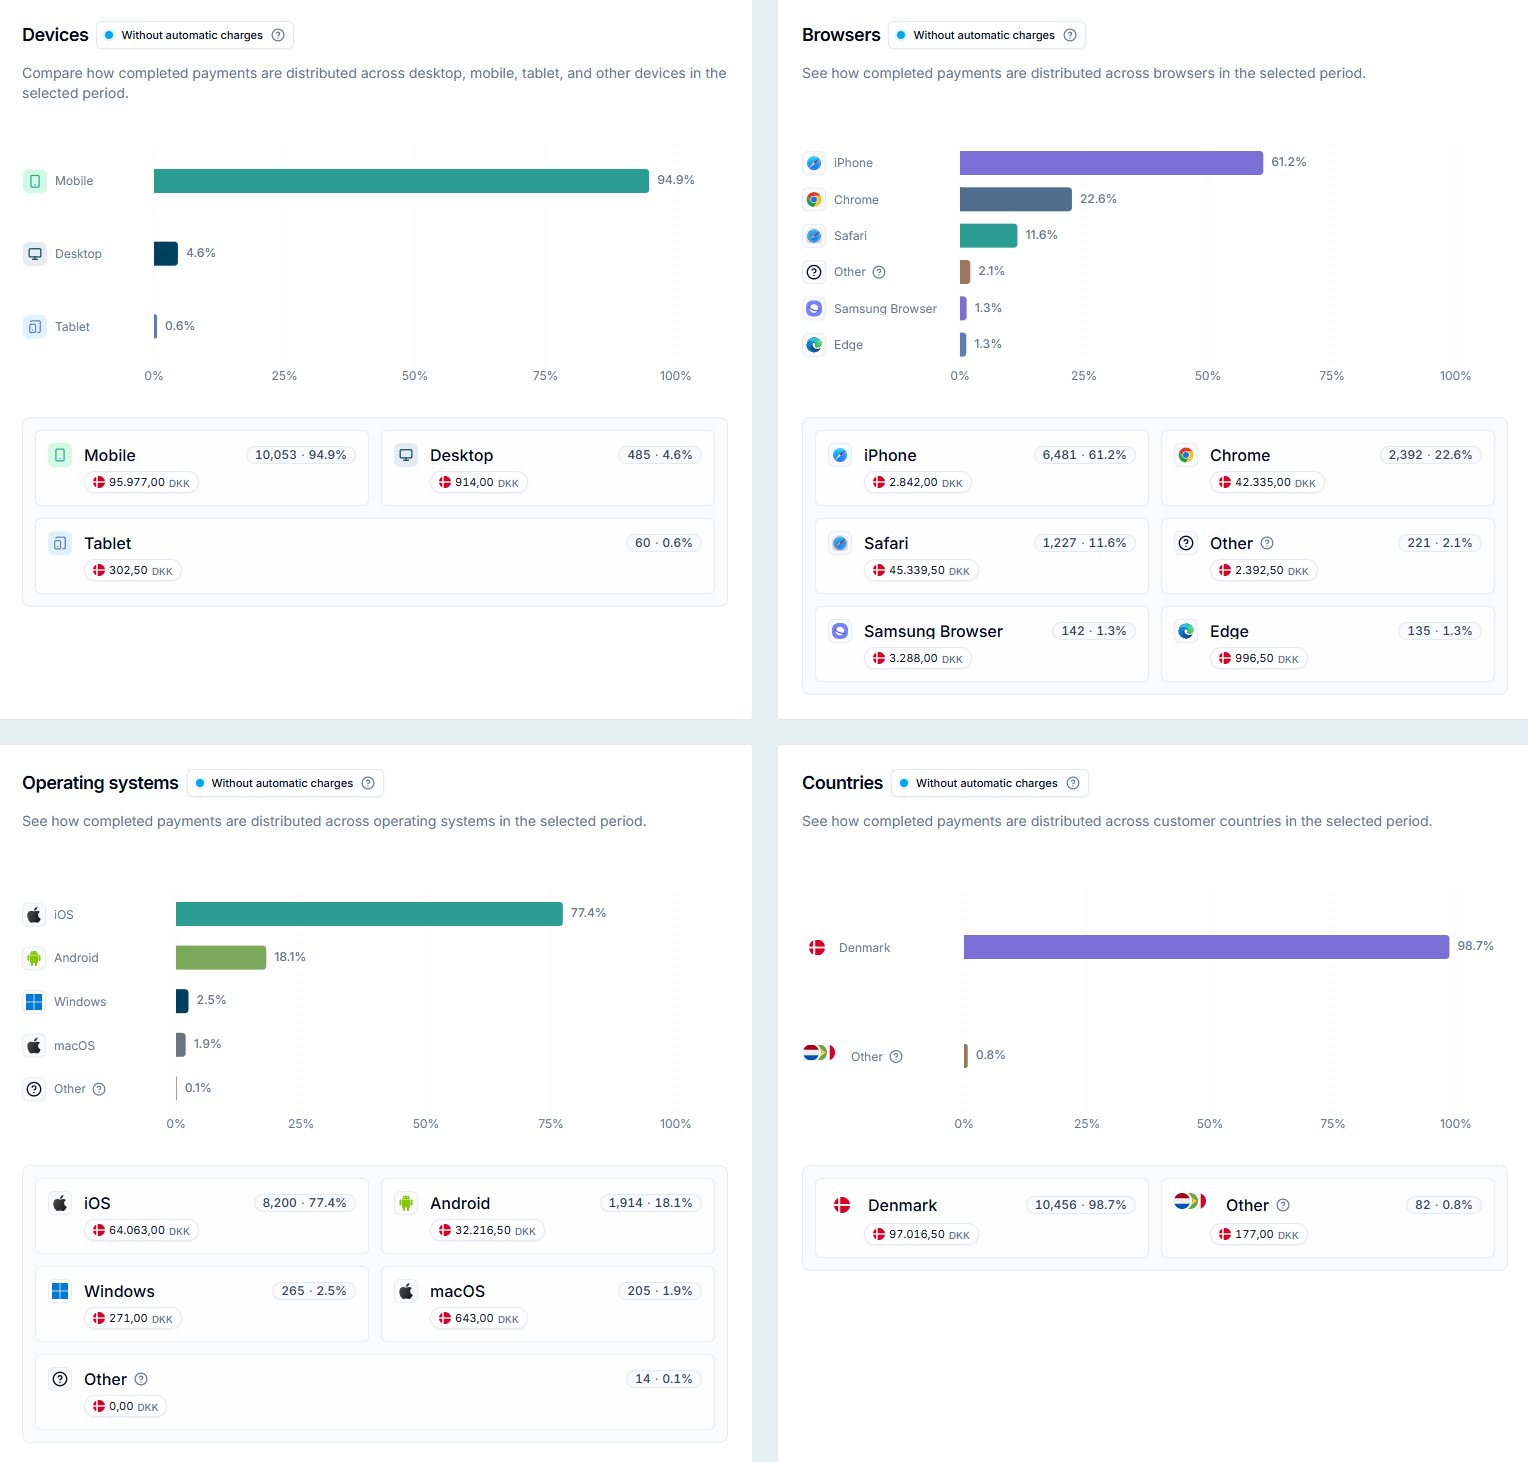
Under devices you can see how many payments come from mobile, computer and tablet. That gives you a better basis for deciding which parts of your checkout to test and optimise. If most of the payments come from mobile, the mobile experience is also where most of your attention should go.
The country breakdown shows where the payments come from. If you spot growing interest from Sweden or Germany, it may be worth taking a closer look at language versions, shipping options or marketing in those countries.
The browser and operating system breakdown is most useful when something is going wrong. If customers report problems in the checkout, you can quickly see whether it affects a small group of users or a browser that carries a large share of your payments.
Approval: see how many payments are approved
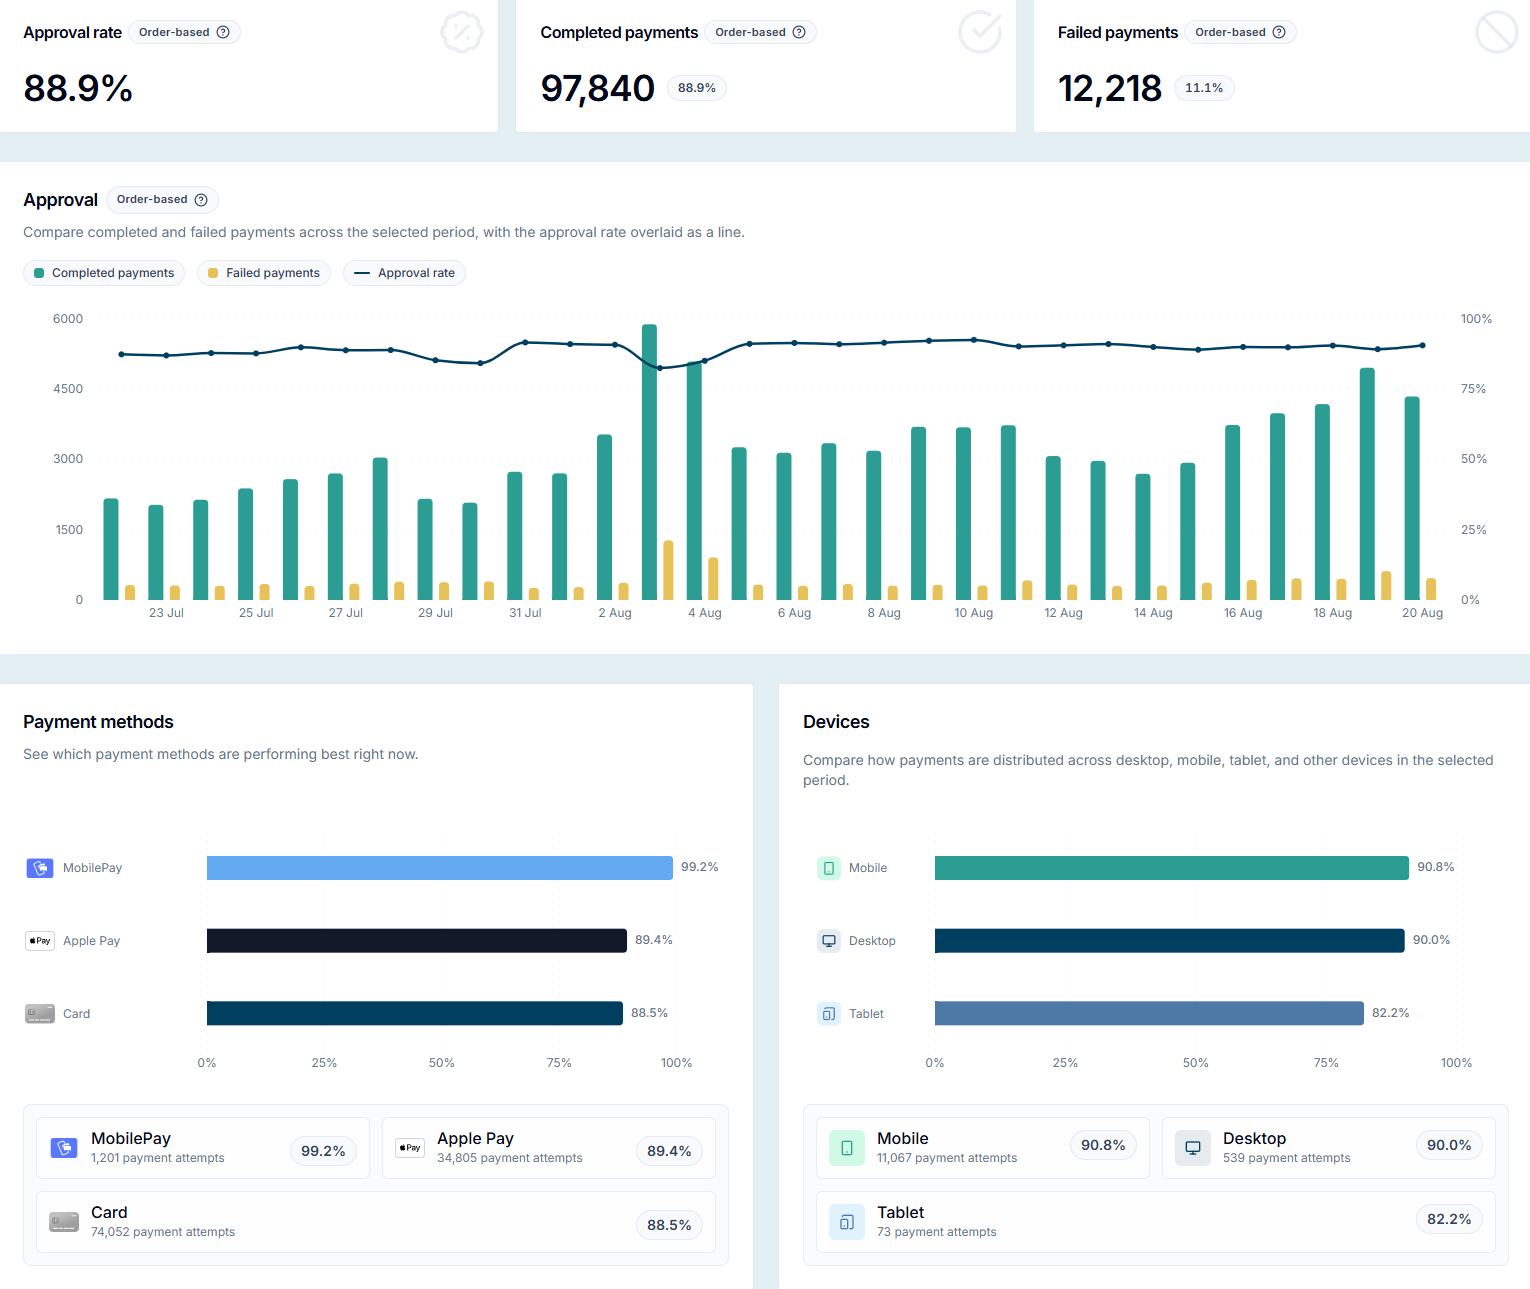
Under Approval you get an overview of your approval rate (the share of payment attempts that end up approved) along with the number of completed and failed payments. The trend is shown over time, so you can more easily see whether a drop comes from one bad day or from something more persistent.
You can also see the approval rate broken down by payment method and device. That makes it possible to spot when a particular payment method performs worse than the others, or when there is a clear difference between payments from mobile and computer.
A lower approval rate on mobile can be a sign that the mobile experience deserves a closer look. It may come from the checkout experience, but also from differences in payment methods, customer behaviour or other conditions.
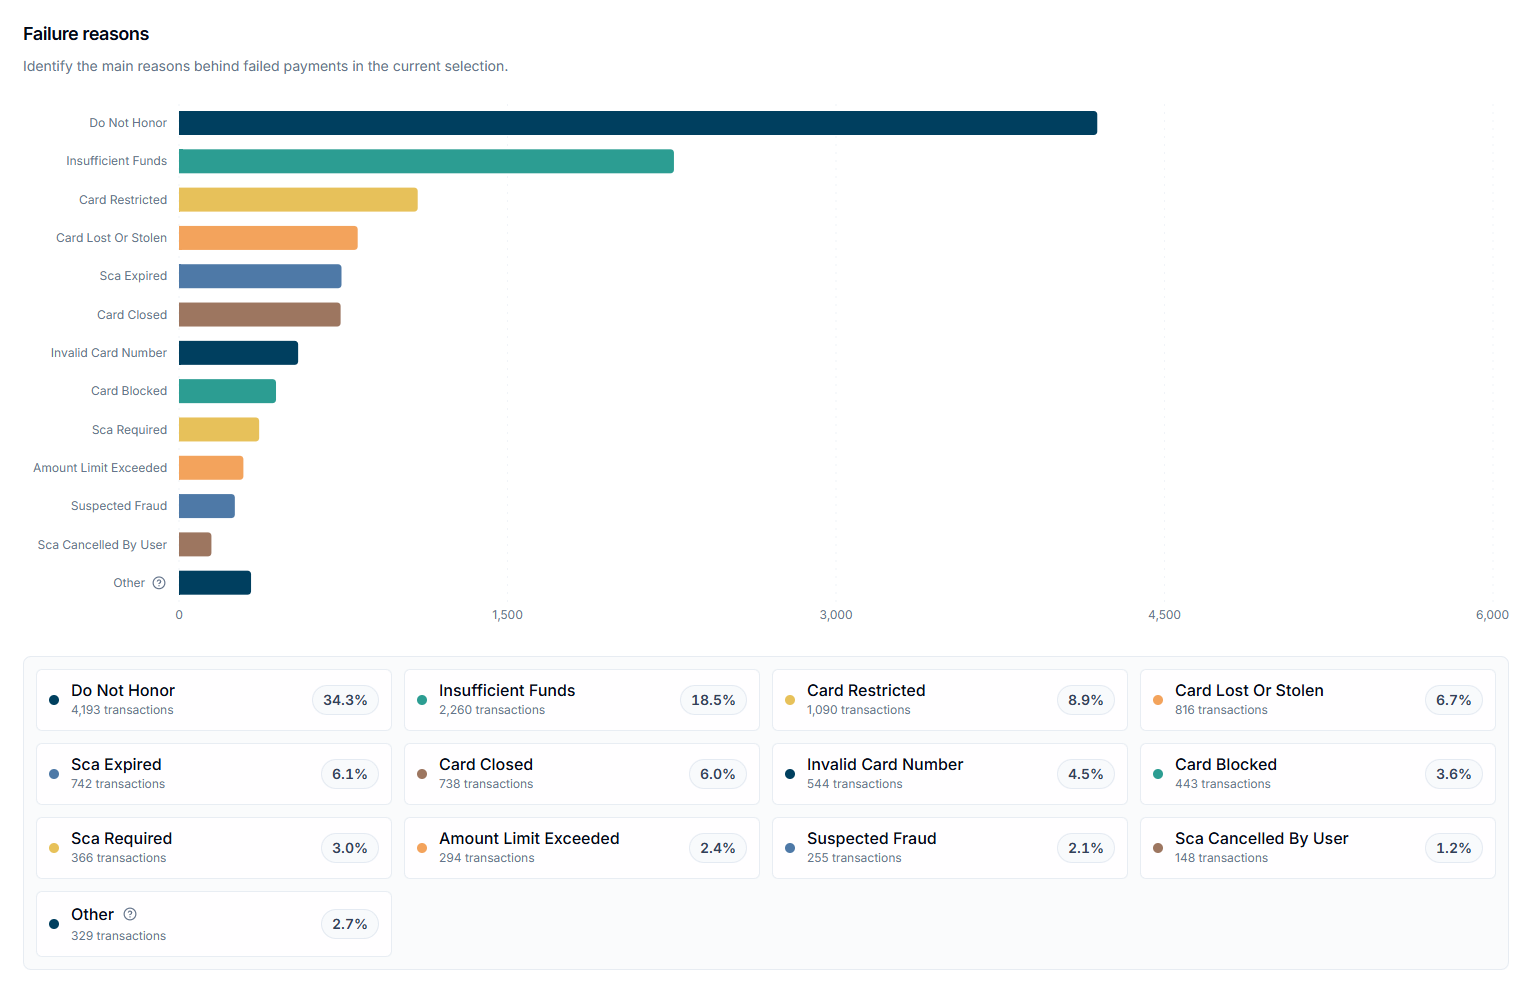
The failure reasons are collected in a single overview. Here you can see what lies behind the failed payments, for example whether the customer cancelled the payment, whether a server error occurred, or whether the payment was declined. Those three are not the same problem. A cancelled payment is a customer you were close to winning, a server error is a technical fault, and a decline is the issuer's decision. Only some of them are yours to act on.
It has previously been possible to see the reason on an individual payment. With Analytics you can also see the breakdown across all of them. That makes it easier to judge whether you are looking at isolated incidents or at a pattern worth investigating.
3DS: see how the security check performs
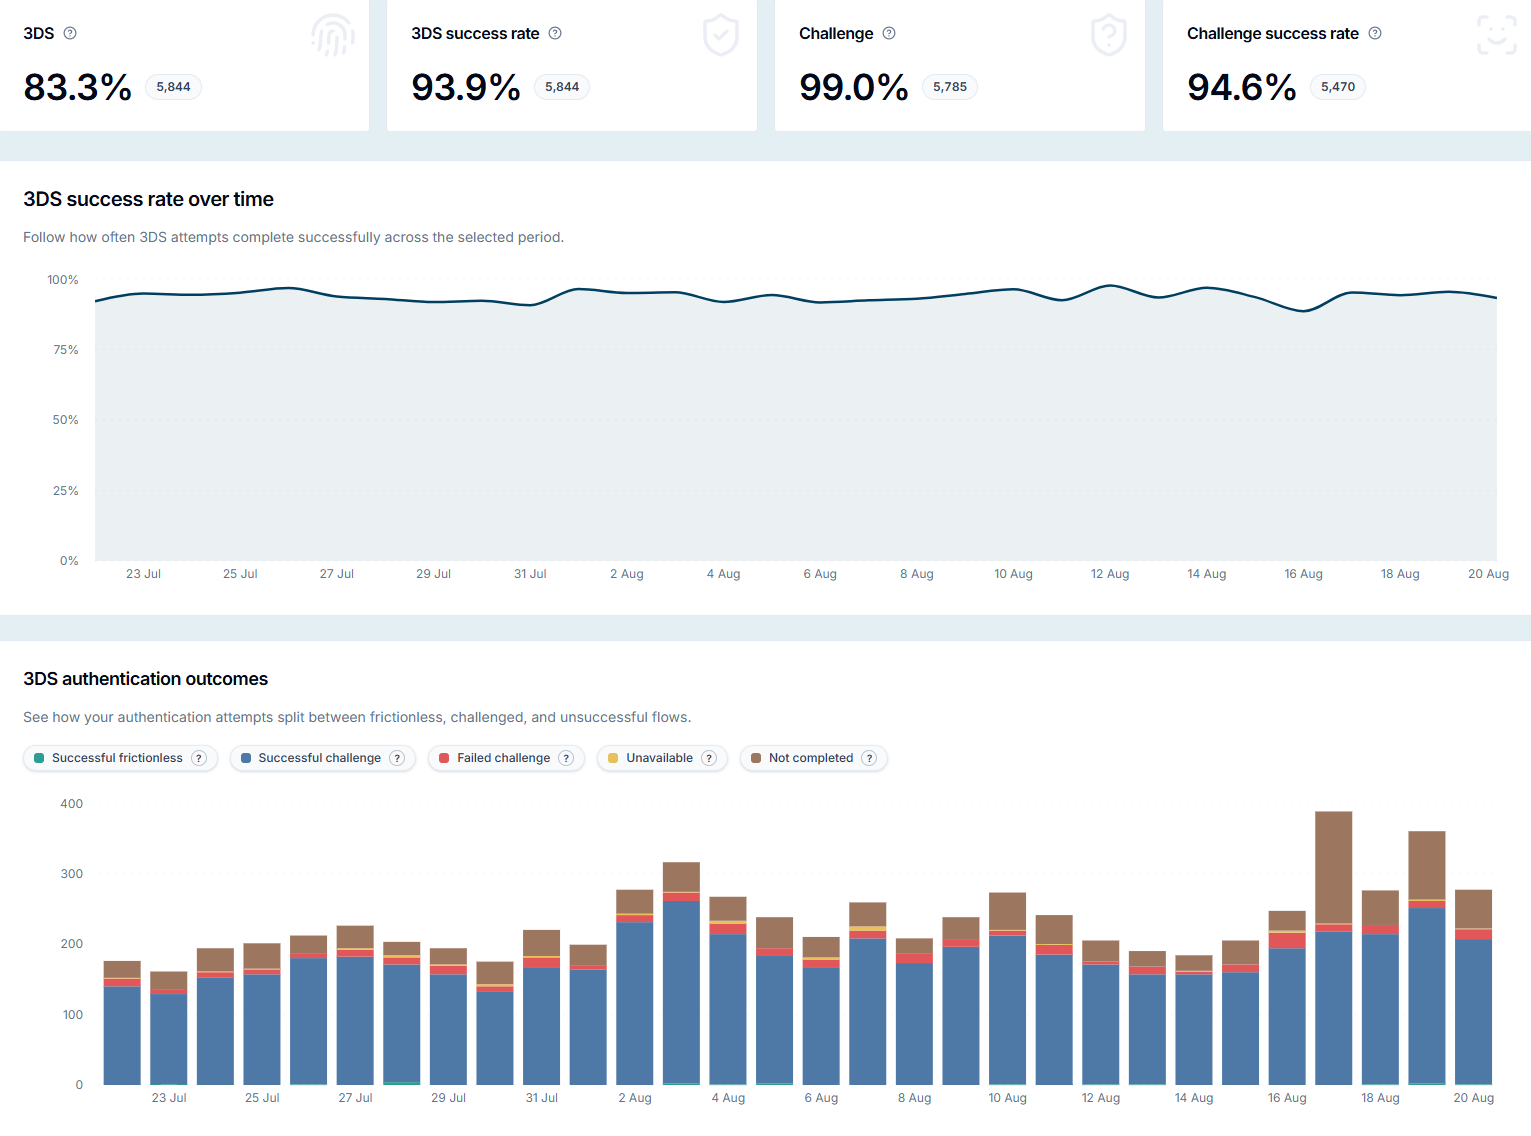
3DS is the extra security check that most card payments in Europe have to go through. Some payments go through without a visible extra step for the customer. That is called frictionless. On other payments, the customer is asked to confirm the purchase with a national eID (MitID in Denmark). That is called a challenge.
At the top of the page you can see what share of your card payments goes through 3DS. You also get an overview of how many 3DS flows succeed, what share ends in a challenge, and how many customers complete it.
The success rate is shown over time as well. That makes it easier to spot changes and to look into whether a drop is temporary or continues over a longer period.
The outcomes are broken down into successful frictionless, successful challenge, failed challenge, unavailable, and not completed, where the customer did not finish the authentication. Hold the mouse over a category and you get a short explanation of what it covers.
If the share of challenges is high while few customers complete them, it can be a sign that part of the drop-off happens during the security check. That gives you a better starting point for understanding where in the payment flow your customers leave.
The practical details
On all three pages you choose the period yourself. You can see data for today, yesterday, or the last 7, 30 or 90 days.
If one category takes up so much space that the others become hard to read, you can hide it by clicking it in the graph legend. That makes it easier to see the split between the smaller categories.
If the numbers are going into a presentation or being shared with colleagues, the page can be exported as a PDF.
Which part of Analytics is most relevant depends on your business. If you sell across countries, the country breakdown is a natural place to start. If you want to understand your failed payments better, you will find the answers under Approval.
Log in to Backoffice, open Analytics and select the last 30 days. You probably already have a hunch about what you will find, that mobile converts worse than desktop, or that one payment method has been quiet since spring. Analytics either turns the hunch into a number you can act on, or shows you that you were wrong, which is worth just as much.
Not with ePay yet? Then the hunch is all you have.